|
PUBLIC BLOG | MEMBERS | ABOUT SVT | CONTACT |
|
|
14-DEC-2012 Before the bell Copper: we had a SOS day with bullish HA candle on copper2D chart. Volume was pretty large, also MFI fell below 50s. Odds are high for a correction for stocks. The reason is simple: Ben did not let the market to go down in November, institutions don't believe in a sustainable rise : a dump needed before a further rise. As FED and Obama want results, my best bet is a kind of squiggling market with lots of bumps: 6-8 days of rise, then 2-4 days of correction or sideways move. Then up a little, then down again. Both bulls and bears will suffer and puke their stakes.The best thing I feel is to draw a trendline after the upcoming squiggle, prepare some popcorn and coke and just wait as long as market is not making a breach of that trendline.
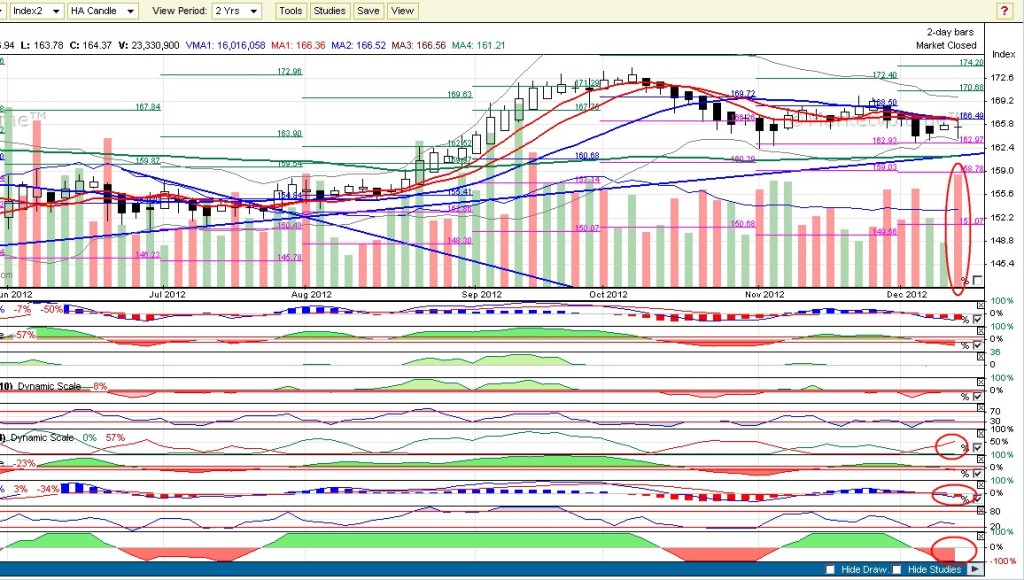
Chart above is RUA2D fakeout. I tried to show two, similar type of popcorn+coke+trendline periods. The best approach was to let Ben play his game these times. I will give you my forecast based on 2D and 1D charts, will give you selling/buying signals according to my system, but please keep your eyes on a possible alternate trading system: simple trendline and breach. According to 2D fakeout chart, we have a SOS bar with positive HA candle. Short-term volume histo started to signal a possible correction, also short-term oscillator is giving weakening signals.Volumes tell the story days in advance... Also, SPX 1425s provide a pretty strong congestion zone. I forecasted this level as a primary target a week ago, and now it looks like smarts believe the same. So, market will correct, it's not a question. What should we do now? It's up to you: I will monitor long-term accumulation vs. short-term accumulation and perform constant fakeout analysis. If you have bad nerves, then you need to liquidate at least a portion of your SPX stakes. I switch to old-turkey and just hold. As long as prices are above their V-MA, corrections are weak and rises are fierce. Also, long histo gives no confirmation: this, current bear should be quick but scary, and the main trend for stocks remains up.
Chart above is GLD 4h
Chart above is gold 2D I like to see gold's reaction. Our expecation was to have a lower-triangle touch - and maybe breach. I gave this forcast days before : I was missing a bottom test. Now that bottom test is in play. Gold's volume-bear cycle is still on: We have a high-volume SOS day with a DOJI HA. This is actually a very good signal. HA DOJIs are rare and we need to check the roots of this indecision. We need to zoom from 2D gold to 1D
If we disassemble that one bar on 2D chart for two bars, we get a clear picture: our large selling bar on 2D constitutes from a 14:9 M bull/bear volume insertion. This, 150% vote for a gold bull shows institutions perform massive buying behind the curtains. Of course, they will do everything in order to freak you out and give further, cheap positions to their greed hands. Again: few days only, and, after a bottom test gold will shine.
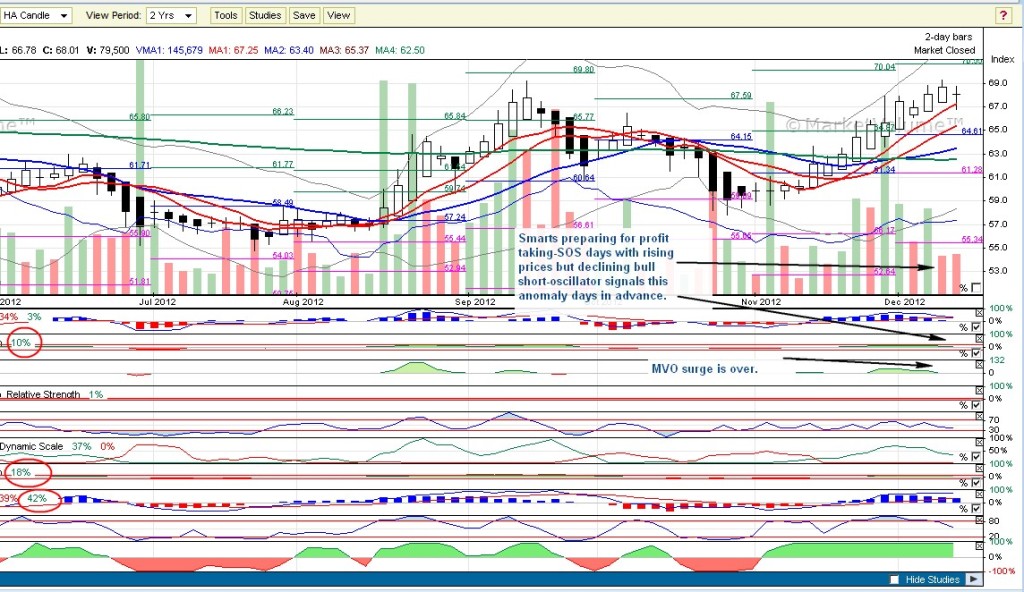
Chart above is palladium 2D. As I told you a week ago, Palladium is extremely bullish and I expected a correction when the MVO surge is over. Please check the palladium 2D chart above: smarts started to pull money out of palladium 4 days ago. They made a SOS day with rising prices in their first two days: while prices were up, short-oscillator signaled decline. MVO bullish surge was over for that time. Now, days after their manipulation, price manifestation arrived. If we perform a fakeout analysis, this, recent correction is just a price manifestation of the exhausted MVO bul surge: long vs. short bullish bet is 18:10. Checking SBV flow, the main trend is up. It is a great news for PM-bulls: gold's bearish cycle is almost over.
Chart above is HUI2D. Regarding to miners, juniors delivered the same phenomenon as gold: 2D large SOS bar, but if we zoom into 1D, we can see a 4M:2.32M bull/bear bet.... And SBV on 1D junior chart started to signal a bull cycle. Miners delivered a similar phenomenon as juniors regarding to 2D->1D zoom. However, as their volumes are much higher, we can perform volume analysis and that will deliver more reliable information: So, we have that ugly SOS-candle. The selling day yesterday was the follow up reaction of the exhausted bearish MVO-contra-relief. Lots of inpatient bulls believed the bear is over and they were ripped off next day. We expected this squiggle. The bad news is, miners are still in a bearish volume cycle on 2D chart.The good news is both short and long oscillator now in sync paired with a positive SBV flow, we have a bear/bull momentum switch on an another 2D HUI chart and we have two positive HA candles: odds are high to see the end of this terrible, 1.5 month of decline. As both equities and gold have high probability for a final hit, my expectation is to have a final dip for miners under their recent pivot (422) and then a trend-change.
Chart above is USO 2D. Oil continues it's fake bear setup. This bearish volume cycle will be quickly over. Silver is in a clear fake bear setup. Silver is waiting for gold and oil to close their bearish cycle and then PMs will start to continue their main trend: up. Dollar has clear signals of a short-term bull cycle, but long-term bets are still bearish.
More Posts... |
|


|
PUBLIC BLOG | MEMBERS | ABOUT SVT | CONTACT |
|
|
(C) 2004-2012 Deric O. Cadora and Atavia, Inc. Terms of Use | Links | Contact Futures and options trading is risky and not suitable for all individuals. |