|
PUBLIC BLOG | MEMBERS | ABOUT SVT | CONTACT |
|
|
19-MAY-2013 Free Public post
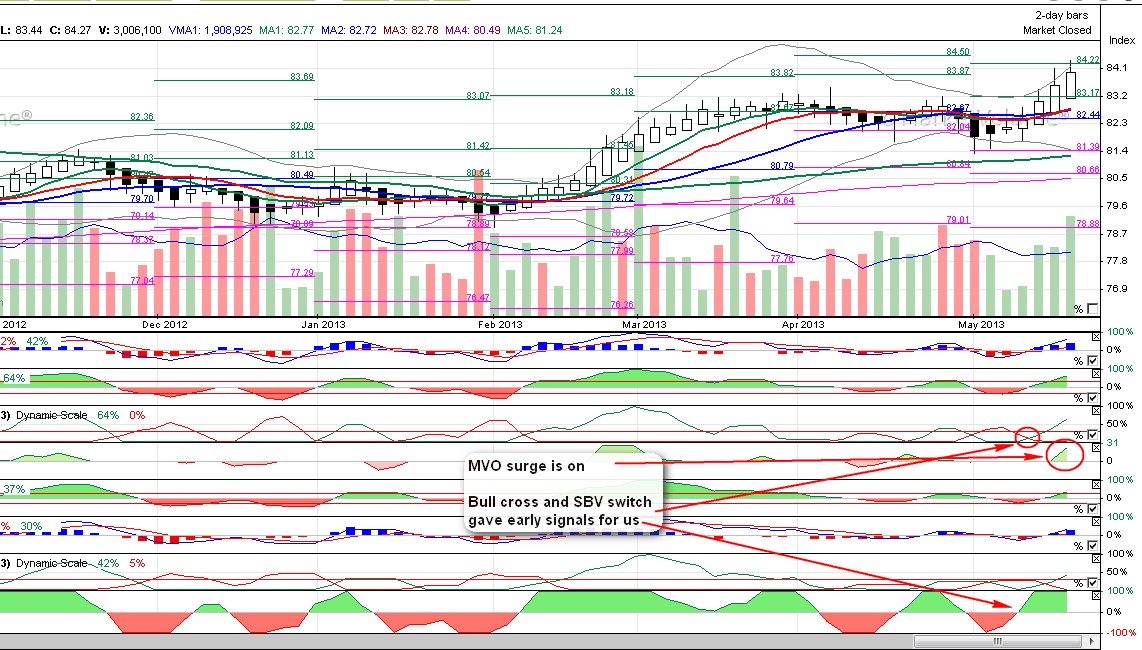
Chart above is dollar 2Df Unfortunately as dollar took it's last year high now it has no technical barrier up to 86.5 - 86.7. I count with a strong BB crash that can result some cool down and loss of the current MVO bull surge. 3D dollar chart has a 2.5 years long pivot at 86.6 level. As pivots are hidden and not visible points, maybe that level will stop dollar for a while at least. I know, I know... I missed the rally in May for equities. As I reported you in my daily letters, we had a mixed reading on RUA (SPX) in April and that reading automatically stopped us to buy the last period of rise. Internals of current bull still signal weak accumulation of long-term bets. Short histo is slowly decreasing, meaning a correction is to come. My best bet was to see a slight correction last Friday for opex, maybe an intraday one and then equities to continue up, but we had no correction at all. This bull became very strong and exhausted for now. 1674-1677 has a pivot now, so maybe SPX will continue it's way up to that point, then a correction should happen will push SPX down to 1610s. VIX is 12.45 while recent low is 11.05, so Ben still has some room left before that technical barrier gives place for some, further rise, but then that rise will carry more and more doubt I feel. We could ride this, current rally from its initial point falling back to the end of last November, and I feel missing two unsafe weeks is not a terrible thing.
Chart above is RUA2Df Volume momentum is still strong for RUA 2D, but started to show divergence versus prices.(while prices were up, it changed to 1.66 from 1.91 in a session of one candle (2 days). Regarding to oil, our last trade has been closed by an expected correction. A fake bear was foreseeable, but its price manifestation knocked our limit, later killed our core. Oil is a volatile instrument and that correction was too strong to go back and make an emotional buy, also dollar signaled a strong bull recently, so we were better to wait a little for dollar bull and equity correction before making a new attempt to go bull for oil. As you see, histo started a decline and while prices are up, we have a negative SBV Flow switch days ago. These signals block us against going long for oil. As price of oil is above of v-MA, bearish bet will not be taken by SVT portfolio, also several MAs had a bull cross on 1D oil. I would like to see the resolution between bearish internals and bullish prices first and then we might try oil again.
Gold held extremely well in front of the rising dollar so far. Gold commenced a bear cycle on 9-th of May and now in stage of fakeout III. Short-term bearish accumulation is -35 while long is -1. While price reaction of current bear is pretty strong, internals show institutions use this cycle to sell their bearish stakes and be neutral in longer term for gold (at least neutral).
Chart above is gold 2D. As long as SBV has no bull cross, we have nothing to do. I will use MFI as a try to enter. I must try at least I feel. I will show you why:
Chart above is miners (HUI) 3D. As you know 3 days accumulation is not the best timing tool, but can help to see internals in general and to see the main trend. 3D HUI chart commenced a bull cycle just now. Also we have an MVO bear/bull switch. Current bear is an end-surge bear within a bull cycle. Damage on miners is pretty large, also 3D charts can cange their last bar retrospectively, but I will keep my eyes on this chart and might try a new entry for gold and gold miners soon.
Chart above is HUI 2D As you can see, buying volume on long SBV is +6 meaning massive institutional shadow-buying of miners. Also, short versus long SBV Flow are not in sync. Regarding to bonds, we detected a bull/bear/bull mid-March and that suggested a bull rally from that time. I warned my readers about profit taking end of April as short histo was struggling and SBV Flow showed dramatic change to bearish. Bonds commenced a bear cycle on 7-May and now we have a well-developed bear cycle with a bear-MVO surge. It means further down or sideways for 20+y bonds (TNT).
Trading update will come in a different, protected premium post. This post is a free, open one, please do not make note about our portfolio. Thanks a lot for your interest and good luck!
More Posts... |
|


|
PUBLIC BLOG | MEMBERS | ABOUT SVT | CONTACT |
|
|
(C) 2004-2012 Deric O. Cadora and Atavia, Inc. Terms of Use | Links | Contact Futures and options trading is risky and not suitable for all individuals. |